LandAttic Map: From Simple Viewer to Full Property Intelligence Dashboard
Posted on 13 February 2026
When we first launched the LandAttic map tool, it did one thing: show property opportunities on a map. It was reliable and fast, but it left subscribers to do most of the discovery work themselves.
Today we're shipping a major upgrade that transforms the map tool into a proper property intelligence platform.
The New Subscriber Dashboard
When you log in now, you're greeted with a dashboard that gives you the full picture at a glance.
What's new right now? Stat cards across the top show you exactly how many new properties have been added today, this week, and this month. For subscribers who check in daily, this immediately answers the question "is it worth looking today?" (The answer is almost always yes.)
Recent properties feed. The left column shows the latest opportunities as they come in, complete with thumbnail images, location details, property type badges, and EPC energy ratings where available. Click any property and you're taken straight to it on the map.
Property coverage heatmap. The right side of the dashboard features a heatmap showing where our property coverage is densest. This gives you a quick sense of which regions have the most activity without having to scroll around the full map.
Regional breakdown. Below the heatmap, a ranked list of regions by property count lets you jump straight to the areas you're interested in. Click a region and the map opens centred right where you need it.
Map Improvements
The interactive map itself has had significant work:
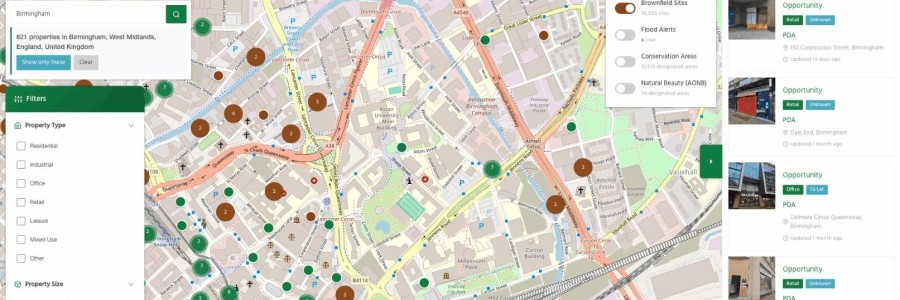
- Brownfield sites overlay. We've integrated government brownfield register data so you can see designated brownfield sites alongside our property listings. Toggle it on from the layers control when you're zoomed in.
- EPC energy data. Properties with Energy Performance Certificates now display their current and potential energy ratings. You can filter to only show properties with EPC data if energy efficiency is important to your investment criteria.
- Property type and size filters. Narrow your view to exactly what you're looking for – residential, commercial, land, retail – and filter by site size.
- Property list view. A toggleable list panel shows properties in card format alongside the map. The list and map stay in sync as you pan and zoom.
- Location search. Search by place name, postcode, or address to jump straight to an area of interest.
- Mobile experience. The full map works properly on phones and tablets now, with touch-optimised controls and a slide-up detail panel.
Why This Matters
Our subscribers are land buyers, property developers, and investors looking for off-market opportunities. The kind of properties that never appear on Rightmove or Zoopla. Every day we're adding new sites to the platform, and the dashboard is designed to make sure you never miss one.
The cumulative effect of these changes is that LandAttic is no longer just a map you check occasionally. It's a daily intelligence tool that tells you what's new, where the opportunities are concentrated, and lets you dive into the details in seconds.
What's Next
We're continuing to improve the platform. If you're a subscriber, log in and explore the new dashboard. If you're not yet a subscriber and you're in the business of finding development opportunities, now is a great time to see what LandAttic can do for you.
Other Articles
Know What a Site is Worth
Estimate the development value of any site in seconds with our Land Appraisal Calculator, used by developers across the UK.
Try the calculator